54, First Floor, South Patel Nagar market, Patel Nagar
Menu
How to identify a trend and trade with it?
Types of Trend?
in Stock Market Analysis, we can devide it into three types of trend.
Uptrend: If the price is continuously making Higher Highs, it is considered an uptrend.
Downtrend: If the price is continuously making Lower Lows, it is considered a downtrend.
Sideways: If the price is moving within a fixed range without a clear direction, it is called a sideways market.
Easiest Way to Identify a Trend
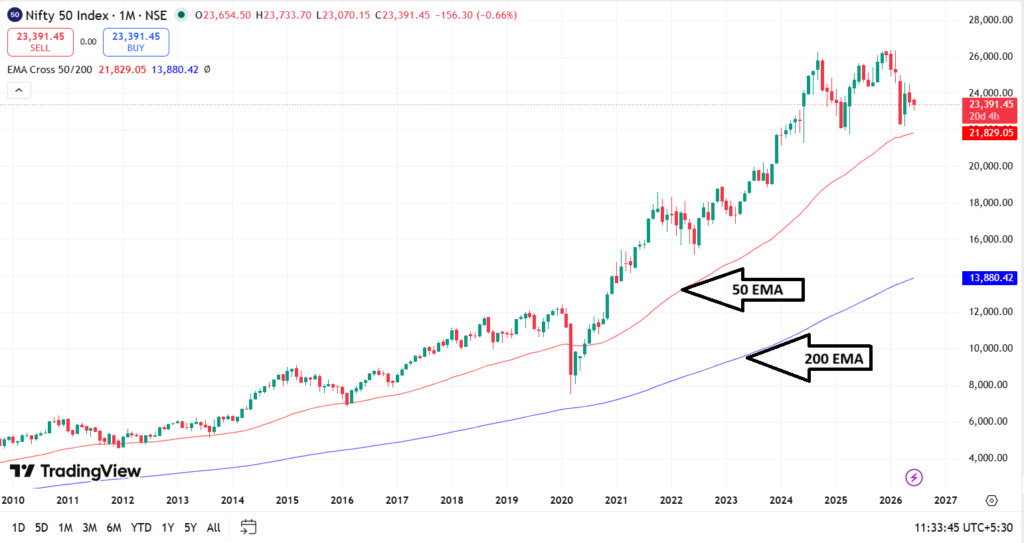
Use the 50 EMA (Exponential Moving Average) to identify the trend.
If the price is trading above the 50 EMA, it indicates an uptrend. If the price is trading below the 50 EMA, it indicates a downtrend.
How to Trade With the Trend
First, identify the trend and take a trade in the same direction.
In an uptrend, buy at every low and sell every high In a downtrend, sell at every higher high and buy every low
Popular Indicators for Identifying Trends
There is no perfect indicator for identifying trends. However, professional traders commonly use the following indicators to idetify a trend Direction:
1. Moving Average
If the 50 EMA is above the 200 EMA, the market is generally considered to be in an uptrend.
If the 50 EMA is below the 200 EMA, the market is generally considered to be in a downtrend.
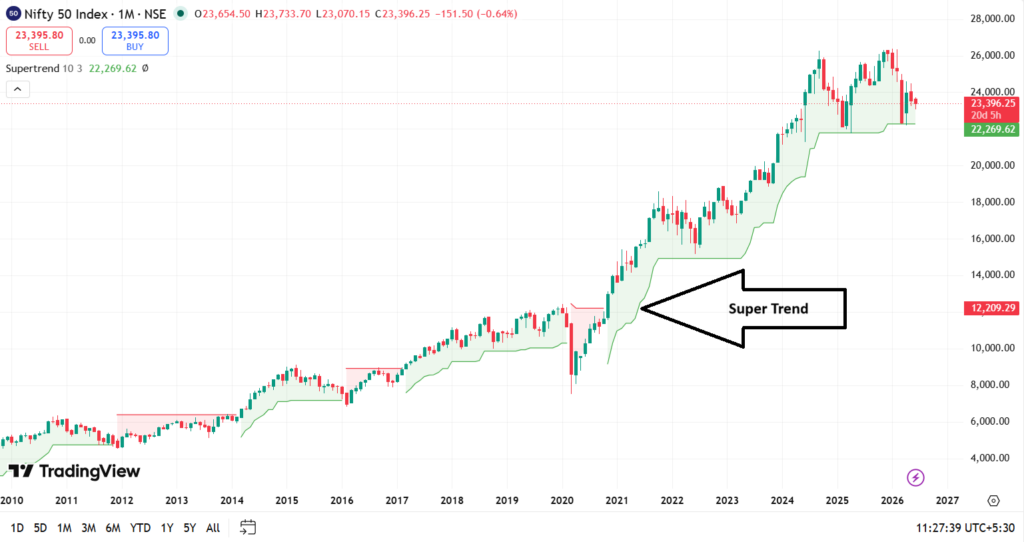
2. Supertrend Indicator
The Supertrend Indicator helps traders clearly identify uptrends and downtrends on the chart.
3. ADX (Average Directional Index)
The ADX indicator measures the strength of a trend, regardless of its direction.
Our Swing Trading Setup
Buy when:
Buy when the price is above the 50 EMA and follow the trend.
The Best Option
If you prefer trading with only one indicator, the 50 EMA is one of the best and simplest choices.